The headline numbers — one table, fully sourced
Most AI-search statistics circulate detached from their sources, which makes them useless in a board deck or a budget meeting. Here is the reference table: each figure, what it actually measures, and where it comes from. Third-party figures link to the primary source in the sources list; figures marked internal are our own tracker and CRM data.
| Statistic | Figure | What it measures | Source · date |
|---|---|---|---|
| Traditional search volume, projected change by 2026 | -25% | Forecast decline as users shift to AI chatbots and virtual agents | Gartner press release · Feb 2024 |
| CTR to the #1 organic result when an AI Overview is present | -62.7% | Measured click-through loss, results pages with vs. without AI Overviews | Ahrefs study · Jun 2026 |
| Same effect, earlier Japanese measurement | -38% | Measured CTR decline for the top result under AI answers (Japan) | PR Times release · 2026 |
| Zero-click share of searches | 23.9% | Searches ending with no click to any website (Japanese measurement) | Hakuhodo DY ONE, AI Search Whitepaper 2026 |
| Consumers using AI tools for purchase decisions | 65%+ | Share of consumers in Taiwan — one of the few published market figures | iPedia industry analysis · 2025 |
| Healthcare AEO/GEO vendor roundups | 71+ agencies | Vendors compared in healthcare-specific AEO agency listicles — a supply-side buzz signal | Stethon Digital · First Page Sage · 2026 |
| Americans traveling abroad for dental care | 850,000+ | 2025 expectation, up from ~780,000 in 2024 | Dentaly · 2025 |
| Overseas patients treated in London | 100,000+/yr | Overseas residents treated yearly, concentrated around Harley Street (2,000+ practitioners) | The National · NCBI |
| Australia inbound medical tourism market | ~USD 445M | 2025 market estimate; researchers forecast ~25% CAGR (optimistic-case figure) | IMARC · Bonafide Research |
| International patients treated in Korea | 2.01M | 2025 official count — the market our methodology was proven in | Korean Ministry of Health and Welfare · Apr 2026 |
| Typical healthcare marketing retainer | $2,500–10,000/mo | Published 2026 benchmark, billed regardless of results | Healthcare Success · 2026 |
| Client clinic revenue change, documented cases | +200% · +186% | Foreign-patient revenue in assigned language lines, two Seoul dermatology clinics (internal; see footnote) | HEIM GLOBAL CRM data |
Every number below gets its context — what was measured, what was projected, and what it means for a clinic deciding where next year's budget goes.
How fast is search behavior shifting to AI?
The most-quoted number in the category is Gartner's: traditional search engine volume projected to drop 25% by 2026, as users move their questions into AI chatbots and virtual agents (February 2024 press release). It is a forecast, not a measurement — worth saying plainly, because it is often cited as if it were settled fact. What makes it credible is that the measured data arriving since points the same way.
The measured data: Hakuhodo DY ONE's AI Search Whitepaper 2026 recorded a 23.9% zero-click share — roughly one search in four ends with the user taking the answer directly from the results page and never visiting a website. And the supply side has already voted: healthcare-specific AEO agency roundups in the US now compare 71+ vendors, while in Japan, comparison articles for LLMO and AIO vendors list around twenty firms each — a category does not attract that much supply without real demand behind it.
What none of these numbers explain is how an engine decides which clinic to name in its answer. That is a different question with a technical answer, and we keep it on its own page: how ChatGPT and Google AI choose which clinics to recommend. This page stays on the data.
What do AI Overviews do to clicks? The CTR data
This is the number that reframes every SEO conversation. Ahrefs' June 2026 study measured what happens to the top organic result when Google shows an AI Overview above it: click-through to the #1 result drops 62.7%. An earlier independent measurement in Japan, published via PR Times, recorded a 38% decline for the same position — smaller, earlier, same direction. The trend between the two measurements is the story: the click penalty for sitting under the AI answer is growing.
Read carefully, this is not "SEO is dead." Organic rank still matters — engines retrieve and cite the pages that rank — but the payoff has moved. The position that captures the patient is no longer only the blue link; it is the citation inside the AI Overview, the ChatGPT answer, the Gemini recommendation. A clinic can hold #1 and still lose most of its former traffic to an answer box that cites somebody else.
Two practical follow-ups, each on its own page: if your practice is absent from AI answers today, the diagnostic checklist is at why is my practice not showing in AI search; if you are evaluating vendors to fix it, the category guide is at healthcare AEO agency.
Are patients already deciding with AI?
Published consumer figures are still scarce — most surveys measure awareness, not decisions. The clearest decision-level number we have found comes from Taiwan: industry analysis reports that over 65% of consumers have started using AI tools for purchase decisions. One market, but a measured one, and healthcare choices are purchase decisions of the highest-stakes kind.
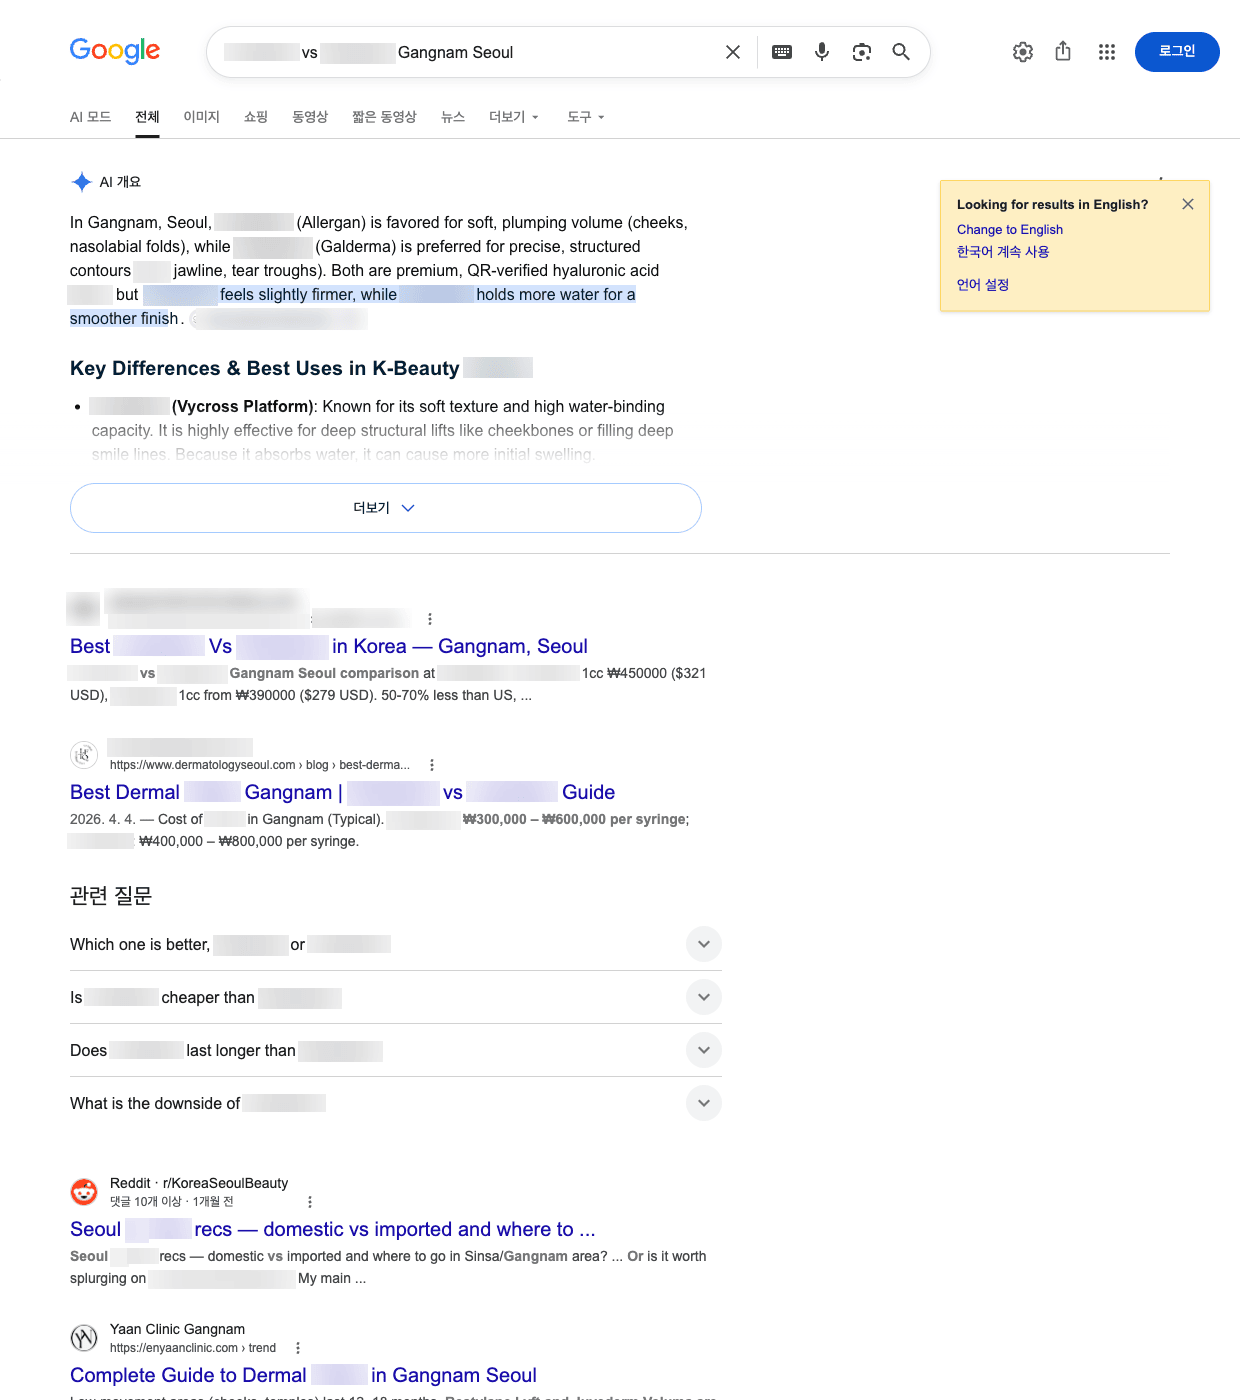
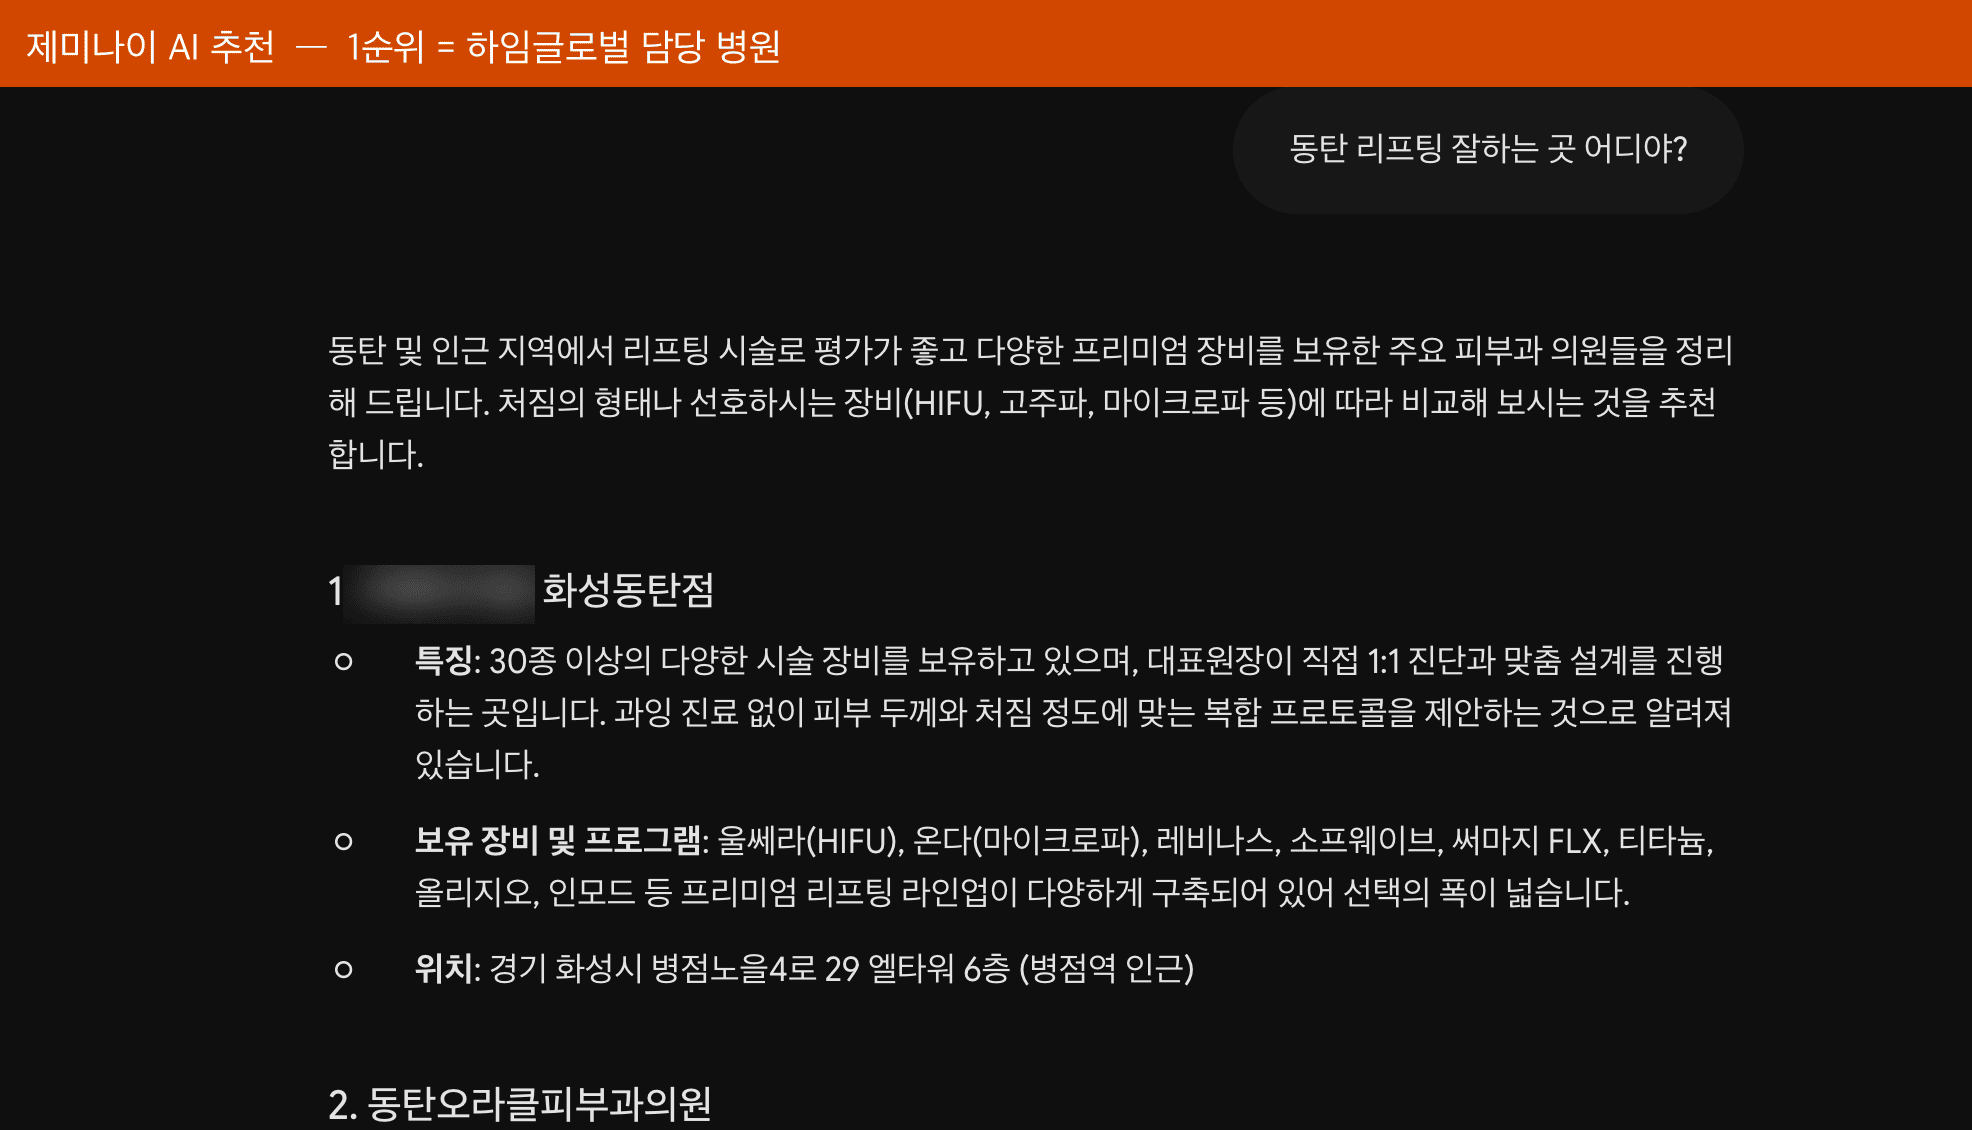
Our own logs supply the healthcare-specific evidence. We query four engines — ChatGPT, Gemini, Perplexity, and Google's AI Overviews — every day, with real patient questions in multiple languages, and record which clinics each engine cites. Client clinics appear in those answers now, by name, in response to questions patients actually ask. The screenshot at the top of this page is one such answer. This is why we treat "are patients using AI?" as a closed question: the citations are in the log, dated, daily.
A note on why an English reference page cites Japanese and Taiwanese sources: some of the sharpest published measurements of AI-search behavior exist only in those languages, and English-language roundups almost never include them. We operate marketing assets in five languages, so we read the primary sources directly. The data travels; the language barrier is ours to solve, not yours.
The patient flows behind the queries
AI-search statistics matter to a clinic only if real patient demand sits behind the questions. It does, and it is measurable, market by market:
| Market | Figure | What it tells a clinic owner |
|---|---|---|
| US — outbound dental | 850,000+ in 2025 | Americans expected to travel abroad for dental care (up from ~780,000 in 2024); estimates run to 3 million trips a year to Mexico for medical purposes overall. Implants abroad price 60–80% lower, with reported savings of $5,000–15,000 per trip — these patients research obsessively before booking, increasingly through AI. |
| US — inbound | ~450,000–1.9M/yr | Inbound medical travel estimates vary widely by methodology; the South (Florida, Texas) holds ~31% of the market on the strength of Latin-American proximity and bilingual capacity. |
| US — domestic multilingual | 68M Spanish speakers | The largest addressable non-English patient community in the West — served natively by multilingual content, not by translation plugins. |
| UK — inbound self-pay | 100,000+/yr in London | Overseas residents treated yearly, concentrated around the Harley Street Medical Area's 2,000+ practitioners; Gulf governments fund treatment and family stays. |
| AU — inbound | ~USD 445M (2025) | Smallest of the three Western markets, with researchers forecasting ~25% CAGR (treat as an optimistic-case figure); IVF and Chinese-speaking community demand are the real segments. |
| KR — the proving ground | 2.01M in 2025 | Korea's official international patient count — the most competitive medical-tourism market in the world, and the one our methodology is documented in. |
The dental numbers deserve their own dataset — volumes, destinations, price gaps, and what they mean for a US practice — and they have one: dental tourism statistics. This page keeps the cross-market view.
Cost benchmarks: what the old model charges for the old game
Context for any budget decision built on the numbers above. Published 2026 benchmarks put the typical healthcare marketing retainer at $2,500–10,000 a month; dental SEO alone runs $750–5,000, a full digital program for a single location $3,000–8,000, and competitive aesthetic fields $8,000–20,000+ — billed whether results arrive or not. Paid search adds cost per click on top: the 2025 all-industry average is $5.26 per click, with dental among the priciest fields at $7.85. And in Australia, the regulatory downside of getting advertising wrong is now quantified too: AHPRA's 2025 guidelines carry penalties of AUD 60,000 per individual and AUD 120,000 per body corporate.
The full rate card — by service, by specialty, including the costs proposals leave out — is published at healthcare marketing agency cost. The short version for this page: the industry charges fixed fees for a game whose click economics the statistics above show to be shrinking. Our model prices it the other way around — $0 upfront, 20% of revenue from the patient lines you assign, CRM-verified, no per-patient counting — so the fee only exists when the revenue does. Four terms always travel together: $0 upfront · non-exclusive · cancel anytime · monthly CRM settlement.
The numbers we measure ourselves
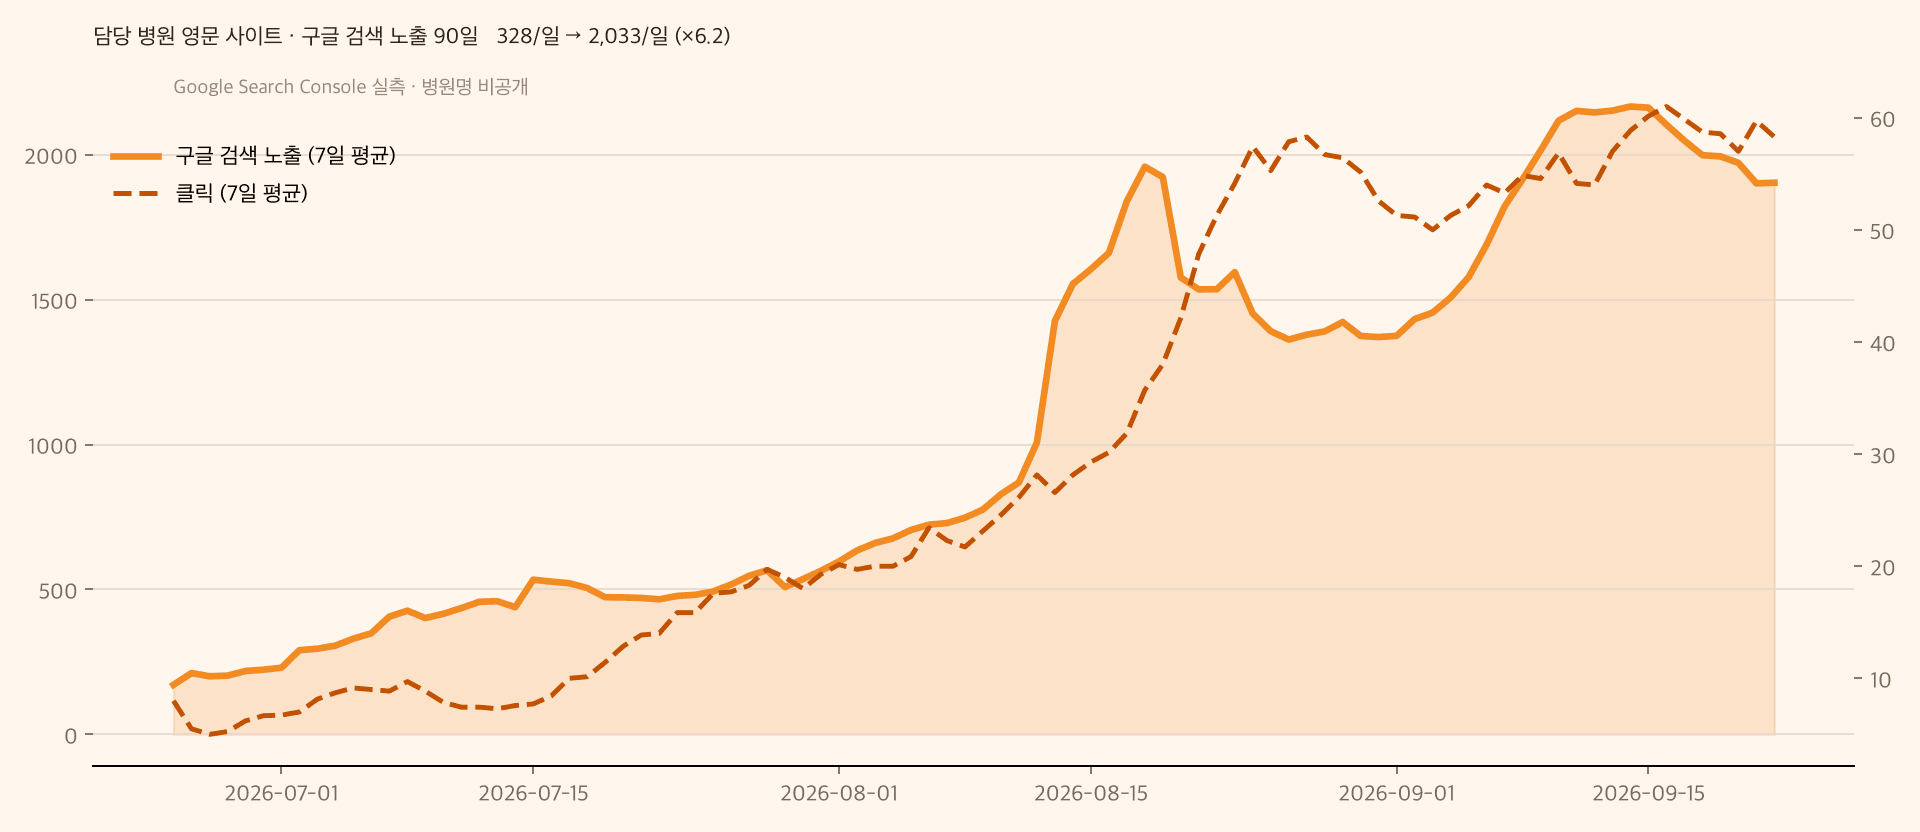
A statistics page should disclose its own dataset. Ours: 7,767 multilingual pages operated in-house across five languages, 2,050 keywords rank-tracked on an automated weekly cycle, and four AI engines queried daily for clinic citations. That infrastructure is what the 20% model funds — and what produced the two documented cases below, in the 2.01-million-patient Korean market.
How to cite this page — and what to do with the data
Citing: third-party figures belong to their original sources — attribute Gartner's forecast to Gartner, the CTR measurements to Ahrefs and the PR Times release, the zero-click share to Hakuhodo DY ONE, and so on; every primary source is linked below so claims can be verified rather than taken on trust. Figures marked internal (page counts, tracker coverage, client revenue changes) are HEIM GLOBAL data and may be quoted with attribution and the stated calculation basis. We update this page as new measurements are published.
Using: the honest sequence for a clinic is baseline first, budget second. Before reallocating anything, find out where your clinic actually stands in the answers patients see today — across Google, ChatGPT, and Gemini, in every language your patients use. That is what the free AI-visibility audit produces: this page's statistics, recomputed for one specific clinic — yours. If the numbers say your market has no headroom, we will tell you that too; a fee that is 20% of results has no incentive to sign markets where results will not materialize.
'/%3E%3C/svg%3E)